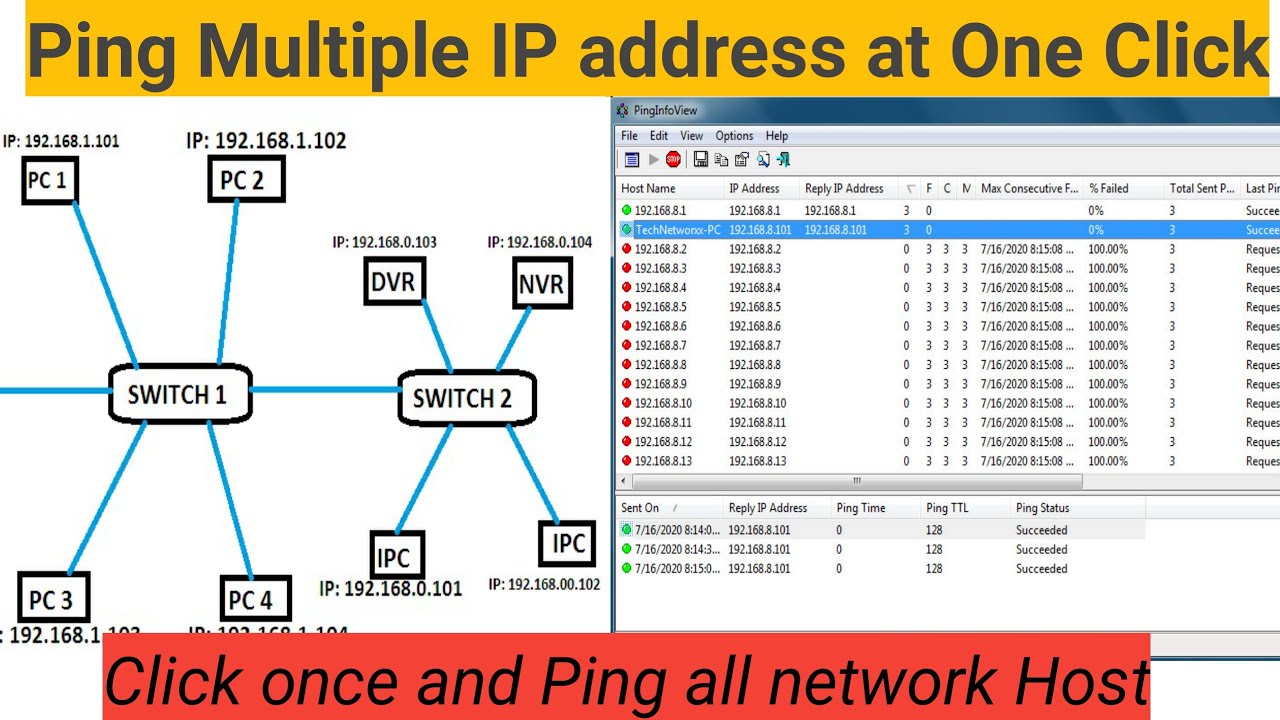
PingInfoView is a powerful yet lightweight tool that allows users to ping multiple IP addresses or domain names simultaneously. This feature is particularly useful for IT professionals, network administrators, and anyone who needs to monitor the availability and performance of multiple servers, websites, or network devices at once. Instead of manually pinging each address one by one, PingInfoView automates the process and presents the results in an organized table, saving time and effort.
By supporting multiple targets, PingInfoView makes it easier to detect network issues, identify unreachable hosts, and measure response times in real-time. Whether monitoring a corporate network, checking website uptime, or troubleshooting connectivity problems, this tool provides valuable insights. Its ability to display success rates, latency, and failure counts allows users to make informed decisions quickly.
How to Add Multiple IPs or Domains in PingInfoView
PingInfoView makes it easy to ping multiple IP addresses or domain names at once, helping you monitor network connectivity efficiently. Here’s how you can add multiple hosts:
Manually Entering IPs or Domains
If you need to add a few IPs or domains manually:
- Open PingInfoView.exe.
- Click File > Start Pinging (or press F5).
- In the Enter Host Names / IP Addresses window, type each IP or domain on a new line.
Example:
google.com
8.8.8.8
yahoo.com
192.168.1.1 - Click OK, and PingInfoView will begin monitoring all the entered hosts.
Importing a List of IPs or Domains from a File
For larger lists, importing from a text file is more convenient:
- Open Notepad or any text editor.
- Enter each IP or domain on a separate line.
- Save the file with a .txt extension (e.g., hosts.txt).
- In PingInfoView, go to File > Load Hosts List from File.
- Select your .txt file and click Open—PingInfoView will load and start pinging all entries.
Using Command-Line to Load Hosts Automatically
For automation or advanced use, you can load hosts via the command line:
- Open Command Prompt (cmd).
- Navigate to the folder where PingInfoView.exe is located.
- Run the following command:
PingInfoView.exe /load hosts.txt- This will launch PingInfoView and automatically import the list from hosts.txt.
Editing or Removing Entries
- To remove an entry, select the IP/domain and press Delete.
- To modify the list, go to Options > Edit Hosts List, make changes, and save.
Best Practices for Managing Multiple Hosts
- Organize Your Lists: Keep frequently used IPs/domains in a separate file for quick access.
- Use Descriptive Hostnames: If possible, add comments in your text file (e.g., # Main Server).
- Update Regularly: Ensure your list reflects changes in your network infrastructure.
Viewing and Interpreting the Results in PingInfoView
Once you’ve set PingInfoView to ping multiple IPs or domain names, the tool will begin sending requests and displaying the results in an easy-to-read table format. Here’s how to understand and interpret the data to get the most out of your network monitoring efforts.
Understanding the Key Columns
Each row in the results corresponds to a different IP or domain you’re monitoring, and the columns provide detailed insights into the status of each host. Here are the key columns:
- Host Name: Displays the domain name or IP address that’s being pinged.
- IP Address: Shows the actual IP address of the host, especially if you entered a domain name.
- Reply Success Count: The number of successful responses received from the host, which helps gauge overall stability.
- Reply Failure Count: The number of failed ping attempts, signaling potential issues with connectivity.
- Last Ping Time: The response time (in milliseconds) for the most recent ping. High ping times might indicate network congestion or issues.
- Average Ping Time: The average response time for all the pings made, giving a general sense of network speed.
- Last Succeeded On: The timestamp of the last successful ping.
- Last Failed On: The timestamp of the last failed attempt, useful for pinpointing outages.
- Status: Displays whether the host is reachable (Success) or not (Failed).
Sorting and Filtering the Results
PingInfoView lets you sort and filter the results, making it easier to identify network issues:
- Sort by any column: For instance, you can sort by Ping Time to see which hosts are responding the slowest.
- Filter for failed pings: Focus only on hosts that are down by using the “Show Failed Pings Only” option.
- Customize visibility: You can hide unnecessary columns, leaving only the most relevant data for quicker analysis.
Spotting Network Issues
Here’s how to interpret the results and identify potential problems:
- Frequent Failures: A high failure count signals that a host is often unreachable, which could point to network issues, server problems, or incorrect configurations.
- High Ping Times: Slow response times often suggest network congestion, routing delays, or overloaded servers.
- Intermittent Failures: If a host is sometimes unreachable but works at other times, this may indicate unstable network connections or sporadic issues on the host’s end.
- Steady Success Rates: If a host consistently replies successfully with low ping times, it indicates that the network connection is stable and performing well.
Using the Results for Actionable Insights
- Troubleshooting: High failure counts or ping times can lead you to investigate network hardware, routing issues, or firewall settings that might be blocking pings.
- Narrowing Down Issues: If only one host is slow or unresponsive, you can rule out network-wide issues and focus on that particular server or device.
- Long-Term Monitoring: Export the results to save them for later analysis or to track performance over time. This is helpful for noticing recurring issues or ensuring that fixes have been effective.
Customization Options in PingInfoView
PingInfoView offers several powerful customization options that allow you to fine-tune your network monitoring experience. Here’s a detailed guide on how you can personalize the tool to suit your needs:
Adjusting the Ping Interval
- What it is: The ping interval defines the time between each ping request to a target host.
- Why it’s useful: A shorter interval allows for real-time monitoring by sending more frequent pings, which is great for critical devices. A longer interval helps reduce network traffic, which may be preferred for less time-sensitive tasks.
How to adjust:
- Open PingInfoView.
- Navigate to Options > Advanced Options.
- Modify the Ping Interval (in milliseconds) to suit your needs—shorter for faster checks, longer for less frequent pings.
Setting the Timeout Duration
- What it is: The timeout setting specifies how long PingInfoView will wait for a response before marking the ping attempt as a failure.
- Why it’s useful: A shorter timeout can quickly indicate a problem but may miss slower responses. A longer timeout accommodates slower networks or devices with high latency.
How to adjust:
- Go to Advanced Options.
- Set the Timeout Duration (in milliseconds) to control how long PingInfoView waits for a response before declaring a ping failure.
Enabling Notification Alerts
- What it is: PingInfoView can notify you when a ping fails, ensuring you don’t have to constantly monitor the screen. Alerts can come in the form of sound notifications or visual cues.
- Why it’s useful: Instant alerts are ideal for catching network issues as they happen, so you can quickly address them.
How to enable:
- Navigate to Advanced Options under the Options menu.
- Enable Sound Notification for an audible alert when a ping fails.
- You can also set a Failure Threshold, which is the number of failed pings in a row required to trigger an alert.
Logging and Exporting Ping Results
- What it is: PingInfoView can automatically save and log ping results, allowing you to analyze performance over time or keep records for troubleshooting.
- Why it’s useful: This feature is crucial for long-term monitoring and provides a historical log of your network’s health.
How to enable logging:
- In the Options menu, choose Log File Settings.
- Select the file format (TXT, CSV, HTML, or XML) that works best for your needs.
- Enable Automatic Logging to ensure results are saved after every ping cycle.
Customizing the Display
- What it is: Customize how results are shown in PingInfoView, making it easier to interpret data based on your specific needs. You can sort results, apply color coding, or adjust the columns to focus on the most important information.
- Why it’s useful: A personalized display helps you quickly identify key issues like latency spikes or unreachable hosts, saving time when diagnosing network problems.
How to customize the display:
- Right-click on columns to sort or hide specific data fields.
- Apply different color schemes to visually highlight problems, like red for failures or yellow for high latency.
- Hide unnecessary columns to simplify the view.
Advanced Troubleshooting Settings
- What it is: PingInfoView offers advanced settings like packet size and the number of pings per host, giving you full control over how the tool tests network performance.
- Why it’s useful: Adjusting these settings allows for a deeper analysis, helping you simulate different network conditions or focus on specific aspects of the network, such as packet loss or latency.
How to adjust:
- In the Advanced Options menu, set the Packet Size to control the size of each ping request (measured in bytes).
- Adjust the Number of Pings per host to determine how many ping attempts should be made in each cycle.
Exporting and Logging Data in PingInfoView
PingInfoView offers powerful features for exporting and logging ping results, allowing you to save and analyze network performance over time. Here’s a detailed guide on how to effectively use these options:
Exporting Ping Results
PingInfoView allows you to export ping results in multiple formats, which is ideal for reporting, analysis, or keeping a historical record of network performance. The supported export formats include:
- TXT (Text): A simple text file format that’s great for quickly saving raw data.
- CSV (Comma-Separated Values): A format ideal for importing into spreadsheet software like Excel, where you can manipulate and analyze the data further.
- HTML: A cleanly formatted web page that presents the results in a user-friendly way, perfect for sharing with others.
- XML: A structured format for those who need to process the data programmatically or with other software tools.
How to Export Data
To export ping results, follow these simple steps:
- Step 1: After the ping test is complete, click on the “File” menu at the top of the PingInfoView window.
- Step 2: Choose “Save As,” and then select the desired export format (TXT, CSV, HTML, or XML).
- Step 3: Select a location to save the file and click “Save.”
Once exported, the data can be opened in the corresponding program, such as a text editor, spreadsheet, or browser, depending on the chosen format.
Logging Data
For users who need to track network performance over an extended period, PingInfoView provides a logging feature. This allows you to automatically record ping results as they come in.
- Step 1: From the “Options” menu, select “Start Logging.”
- Step 2: Choose where you want to save the log file and select the format (either TXT or CSV).
- Step 3: PingInfoView will append the results to the log file, allowing you to track network performance continuously.
- Step 4: When you’re done, simply go back to “Options” and select “Stop Logging.”
Benefits of Exporting and Logging Data
- Long-Term Monitoring: Perfect for tracking the status of your network or servers over days, weeks, or months.
- Report Generation: Exported files are ideal for sharing ping results with your team, clients, or upper management.
- Troubleshooting: Logging and exporting results makes it easier to identify recurring issues or patterns in network performance.
- Record-Keeping: Maintain a historical record of network uptime and latency for audits or future reference.
Advanced Export Features
- Automated Exports: You can set up automated exports to run at specific intervals, allowing you to collect data without manual intervention.
- Customizable Layouts: For advanced users, PingInfoView offers customization options that enable you to adjust how the results are presented in the exported file. This is useful if you need to tailor the export to your specific reporting needs.
Use Cases and Benefits of Pinging Multiple IPs or Domains at Once
Monitoring Multiple Servers
For businesses with several servers (such as web servers, database servers, or internal services), monitoring uptime is crucial to avoid disruptions.
- Use Case: An IT admin can use PingInfoView to check the status of several servers simultaneously, ensuring all are up and running without manually pinging each one.
- Benefit: It saves time, offers a real-time overview of the network’s health, and allows for quicker identification of issues across multiple systems.
Website Uptime Monitoring
For any business that relies on an online presence, ensuring that websites or applications remain accessible is a top priority.
- Use Case: Website owners or administrators can ping their sites and those of competitors, ensuring that their services are always available to users.
- Benefit: Immediate detection of website downtime or slow response times means faster problem resolution, reducing potential losses in traffic or sales.
Troubleshooting Network Issues
Network connectivity problems can stem from internal issues, such as router misconfigurations, or external ones, like ISP outages.
- Use Case: A network technician can ping various internal devices and external services simultaneously to identify where a problem lies.
- Benefit: It accelerates the troubleshooting process, helping pinpoint whether the issue is local (e.g., internal network) or external (e.g., internet service provider), leading to faster resolution.
Large-Scale Network Performance Monitoring
In larger organizations or those with extensive network infrastructures, ongoing monitoring is essential to avoid bottlenecks or service interruptions.
- Use Case: Network admins can monitor multiple routers, switches, and devices across various locations or departments in real-time.
- Benefit: Enables proactive identification of performance issues, ensuring the network is optimized for speed and efficiency, and reducing the risk of downtime.
Data Center and Cloud Infrastructure Monitoring
Data centers and cloud-based services require constant monitoring to ensure uptime and availability.
- Use Case: IT teams can ping multiple cloud services, servers, or data center equipment to ensure everything is operational and there are no connectivity issues.
- Benefit: It provides real-time visibility into the performance of cloud-hosted services and infrastructure, helping to prevent potential issues before they affect operations.
Multi-Location Network Monitoring
For organizations with offices in multiple locations or global teams, connectivity between offices needs continuous monitoring.
- Use Case: IT admins can ping multiple locations, ensuring seamless communication and data flow between branches, no matter where they are.
- Benefit: Detects any slowdowns or connection issues between offices, ensuring consistent performance across geographically dispersed teams.
Benchmarking and Performance Analysis
For services where speed and reliability are key, businesses can use pinging to measure and compare response times.
- Use Case: Web developers or network engineers can ping their services alongside competitors’ to compare performance and identify any lag or network delays.
- Benefit: Helps optimize network performance and aids in decision-making about infrastructure improvements or identifying slow-performing areas.
Conclusion
PingInfoView’s ability to ping multiple IPs or domains simultaneously is an incredibly useful feature for anyone needing to monitor network performance or troubleshoot connectivity issues. Its intuitive interface provides a quick and easy way to assess response times and identify failures across multiple devices or servers. For network administrators or IT professionals managing large-scale networks, this functionality proves invaluable for maintaining network health and addressing problems proactively.
Additionally, PingInfoView offers flexible customization options, such as adjustable ping intervals, timeouts, and comprehensive export formats, which enable users to track and analyze performance data over time. Whether you’re overseeing a small home network or a vast enterprise system, PingInfoView simplifies network monitoring and troubleshooting. Its portability and efficiency make it an essential tool for anyone looking to streamline network management while gaining crucial insights into connectivity and performance.